In this tutorial, we explain how to use Query Monitor, understand its reports and take the right actions. You will be able to understand what causes performance problems in your site and take the right steps to resolve them.
Installing Query Monitor
To install the plugin, visit the Plugins page in your site’s admin and click the Add New button at the top. In the search field, enter “query monitor” and click the Install Now button. Finally, click the Activate button when it appears.
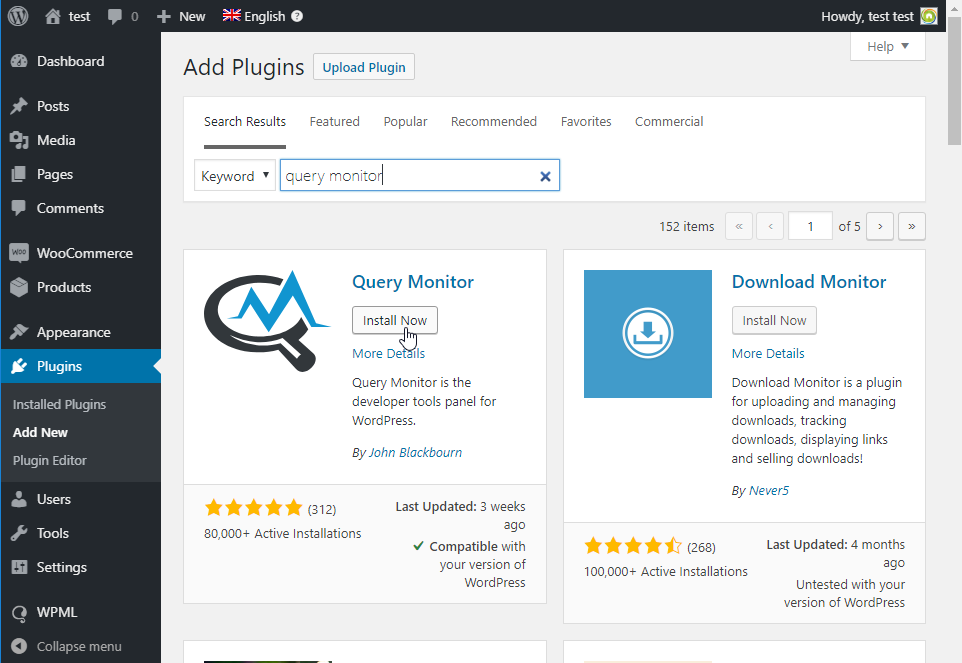
Please note that Query Monitor requires significant resources by itself. You should activate it only to identify performance problems and deactivate it afterward.
Enabling the authentication cookie
You want to see how your site performs for visitors (not only as an admin). Query Monitor lets you do this using an “authentication cookie”.
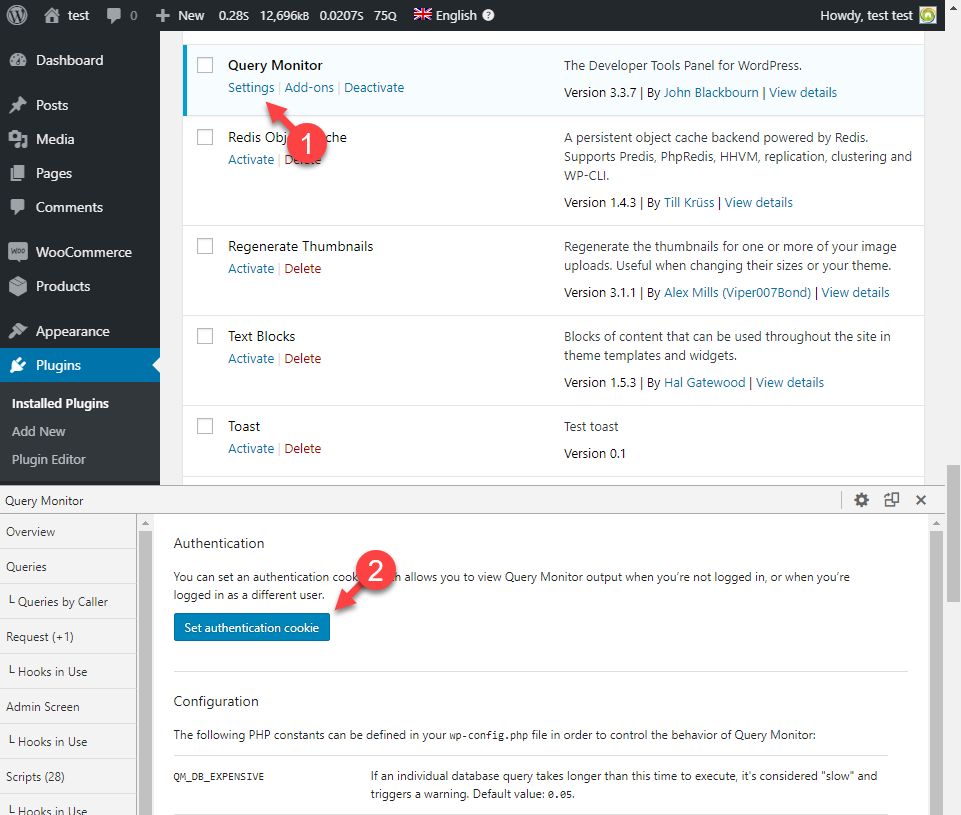
Go to the Plugins page, find Query Monitor and click its Settings link. The plugin window opens at the bottom of the page. Click the Set authentication cookie button.
How to use Query Monitor
Once Query Monitor is running, the Admin Bar will display a set of performance values that look like this:
- 0.17s 10,453kB 0,0323s 123Q
They show values for the page load time, memory used, database-requests time, and a number of database requests.
Hovering this information opens the Query Monitor’s dropdown menu. Click any menu item to open an additional panel with more information.
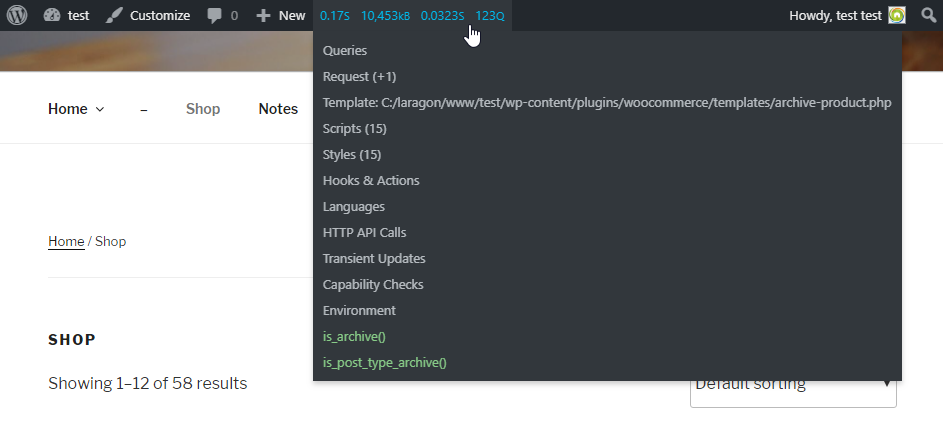
For testing performance, the first menu item, Queries, is the most interesting one. Click it and a panel shows up with a lot of vital information about database queries.
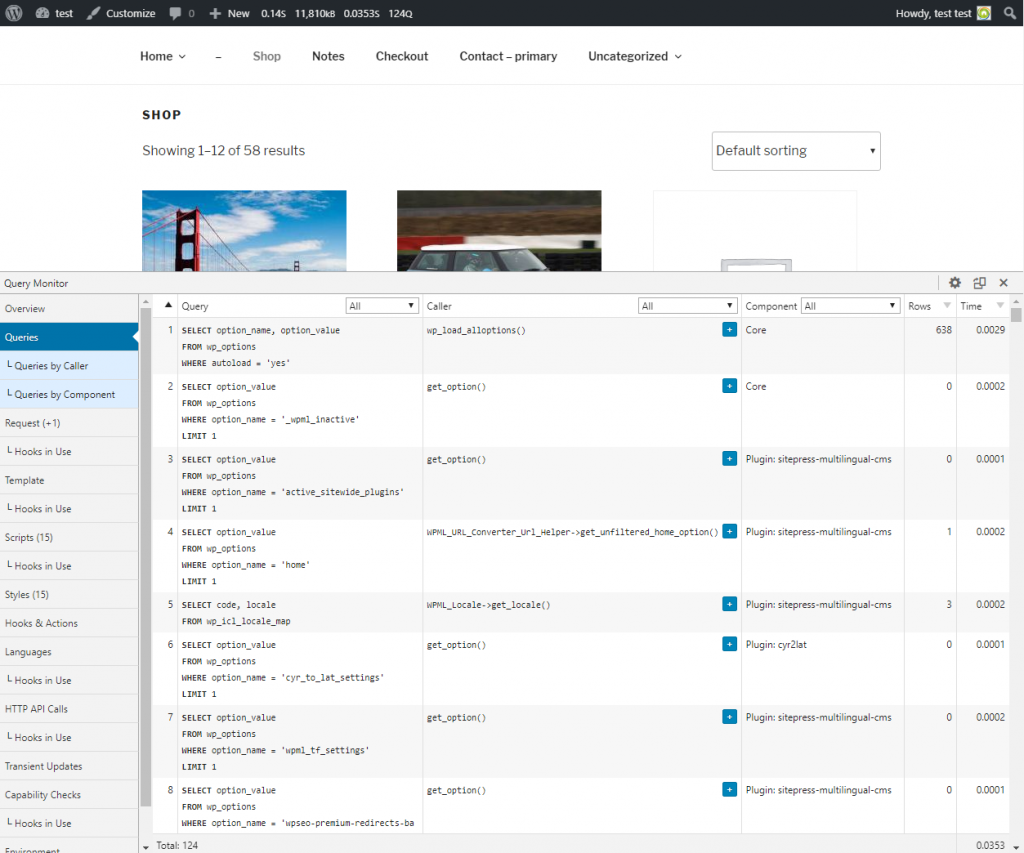
Reading the information
The most important way to query the database in WordPress is by using the WP_Query class. You can sort queries by order, the number of affected rows, and time. Sorting by time allows you to focus on the heaviest queries first.
In our example, our test site’s heaviest query is from wp_load_alloptions() and WP_Query->get_posts().
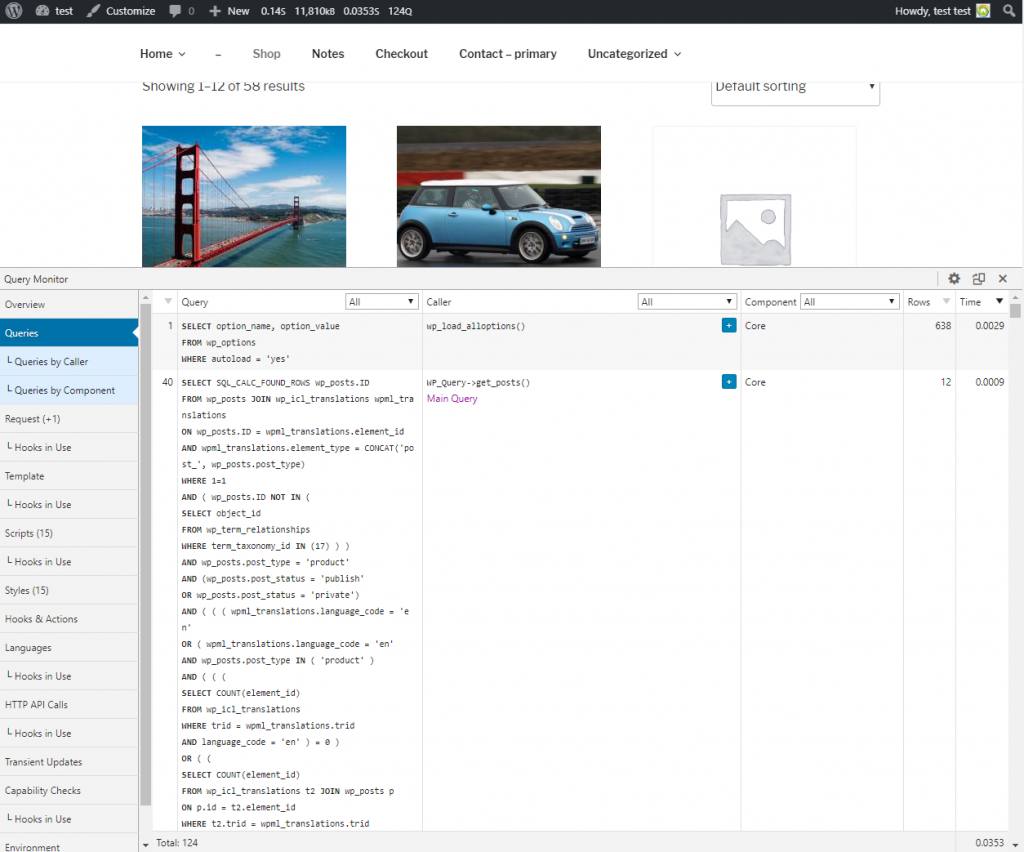
The first one loads all options for plugins and themes. It’s coming from the WordPress core so we cannot do anything to improve it.
The second query is coming from get_posts(). Because we are currently on the WooCommerce Shop Page, this query loads products.
Filtering results by plugins
Queries can be filtered by components (plugins), and we can see that on the test site we have quite some calls made by our WP Happy Blog test plugin. The total time is 0.0179s out of 0.0651s (shown at the top, in the Admin Bar).
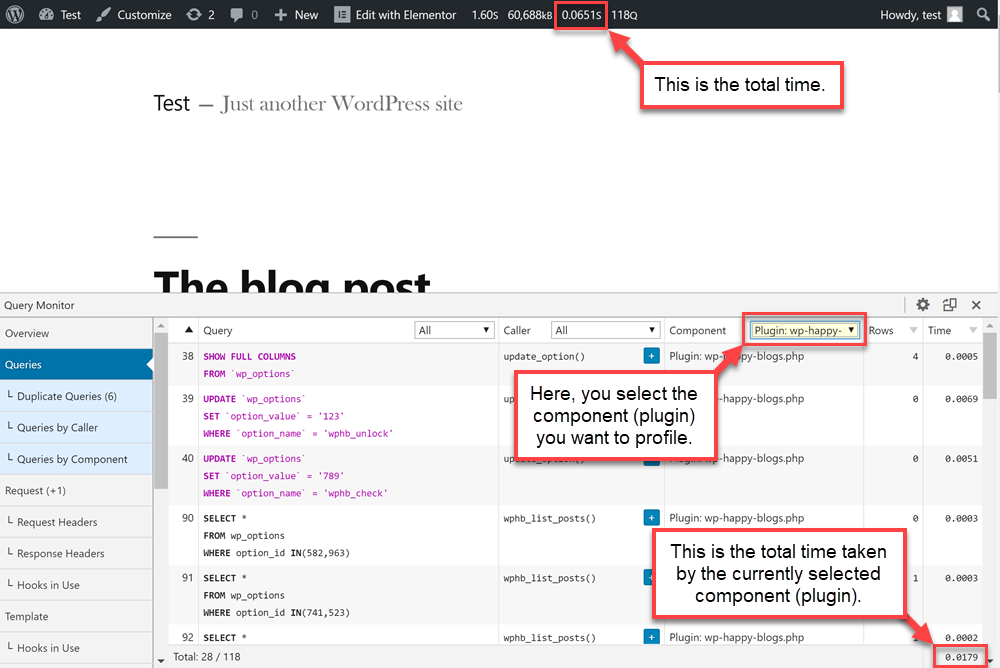
So, nearly one-quarter of the calls were made by this plugin. This may seem a lot, but it also depends on what the plugin is doing.
Profiling
How much a specific plugin queries the database can vary, depending on the number of installed plugins and their settings.
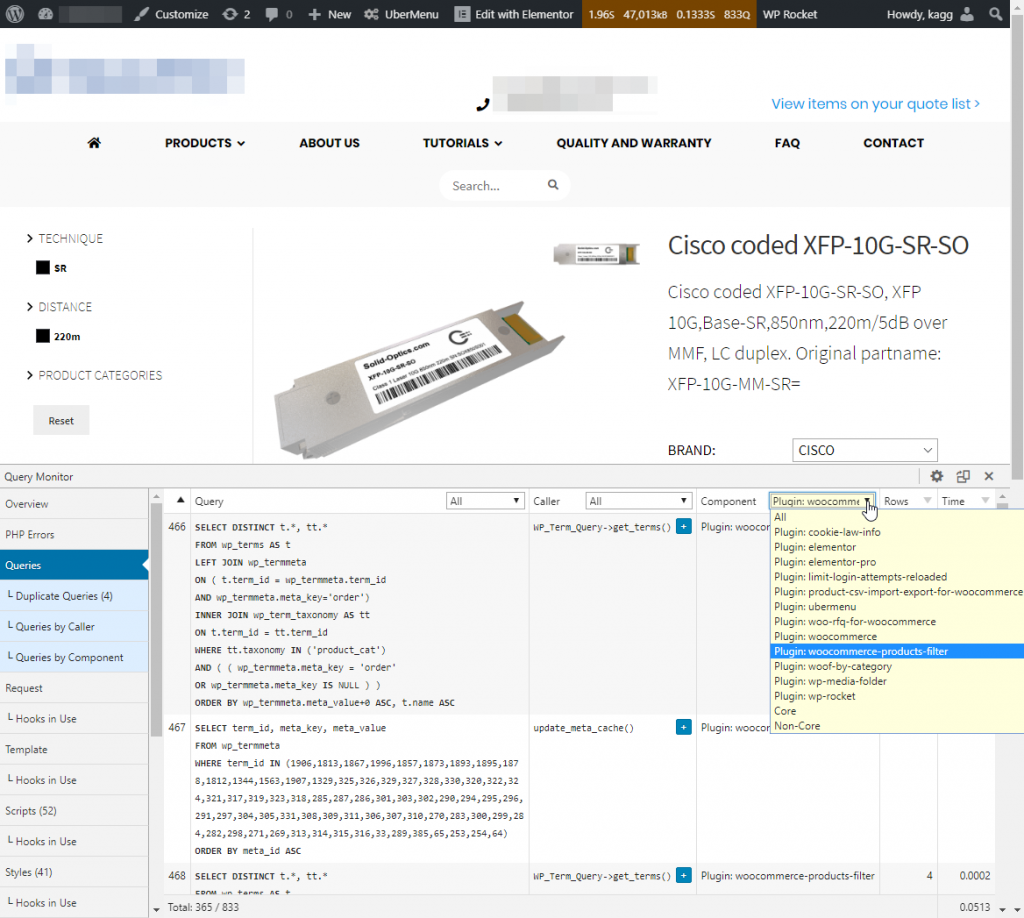
In the next image, we can see that almost 50% of the database request time (0.0513s out of 0.1333s) is taken by the woocommerce-products-filter.
How to improve your site’s performance
As you analyze the site performance it is best to first find out which plugin takes most of the database request time. Try deactivating such a plugin, or replace it with something better.
If you are not sure which plugin is slowing down your site, you can temporarily deactivate plugins one by one and see the impact on performance.
Also, try switching the theme to the default one and see the performance impact. We encountered cases where some inefficient plugins and themes made too many requests to the database via WPML.
WPML-related issues
When a problem seems to be related to WPML, it’s good to check which WPML plugin creates the most performance impact.
In any case, make sure your site is running the latest version of WPML plugins.
Still having performance issues?
If you are still having issues, we suggest following our tips about preventing performance issues with WPML.
If following the steps on that page doesn’t help it’s best to open a ticket with our support. Our supporters can take a look at your site and analyze where the issues are coming from.

Amazing article! I wasn’t aware of this plugin! Thank you very very very much!!! 🙂
Thank you for your kind words, I am happy to hear it’s helpful! 🙂