You can debug performance problems by analyzing your database queries using a plugin like Debug Bar and its Sort Queries add-on.
What is the Debug Bar plugin?
The Debug Bar and Sort Queries add-on lets you see a detailed breakdown of the queries running on every page of your site. By analyzing these queries, you can identify which pages slow down your site.
How can I install the Debug Bar plugin?
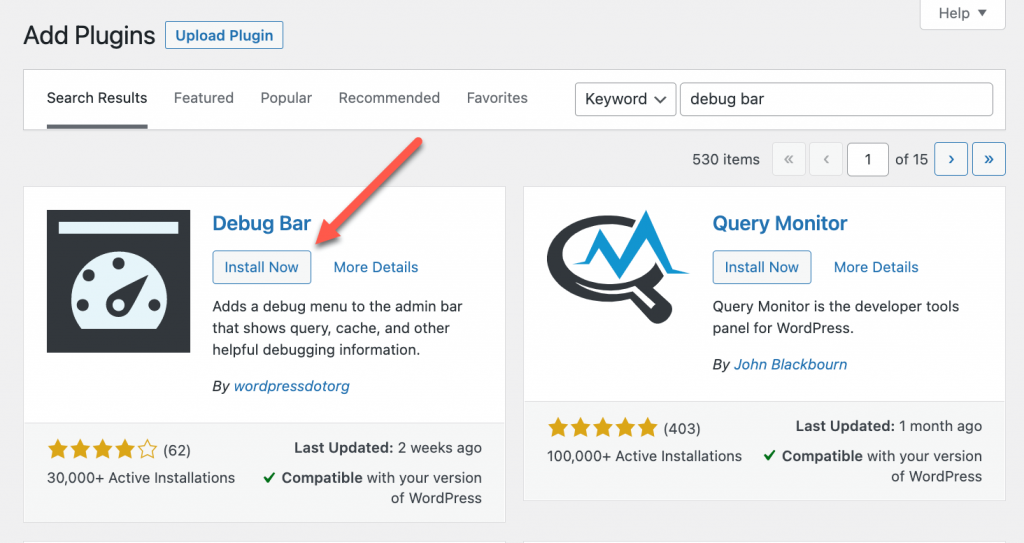
You can install the Debug Bar plugin via the Plugins page in your WordPress admin.

To install the Sort Queries add-on, download its file and upload it to your site.
Disable Xdebug
If you’re using Xdebug, make sure to disable it before you start with performance testing. Xdebug will cause significant load on your server and alter the results.
To disable Xdebug, remove the directive below from your php.ini file or conf.d/xdebug.ini file:
zend_extension=xdebug.so
This is how the phpinfo file should look like when Xdebug is not running:

As soon as this does not contain any reference to Xdebug, you can be sure it’s turned off.
Whether or not other sections of this phpinfo file contain references to Xdebug is not important, so long as it is not shown as a loaded extension at the top.
How can I configure the Debug Bar?
The Debug Bar has a couple of debugging options:
WP_DEBUG– to identify problems in your code and track PHP Warnings and NoticesSAVEQUERIES– to identify any performance issues on your site and to track and display MYSQL queries.
To enable these options:
- Open your wp-config.php file.
- Scroll down to the line that says
/* That’s all, stop editing! Happy blogging. */. - Enter the following code:
define( 'WP_DEBUG', true );

define( 'SAVEQUERIES', true );
How to debug a page?
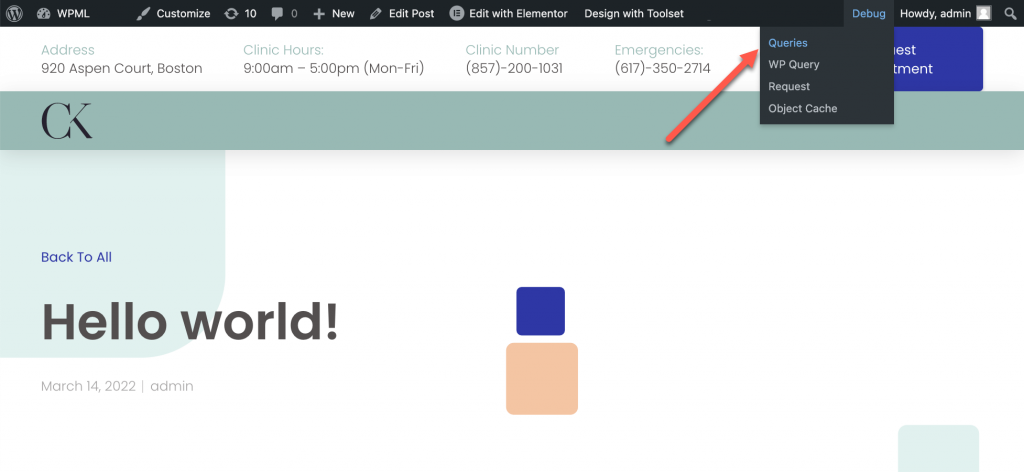
While logged in as admin, visit any page you feel is causing your site to run slowly. Then, from the top admin bar click on Debug → Queries.

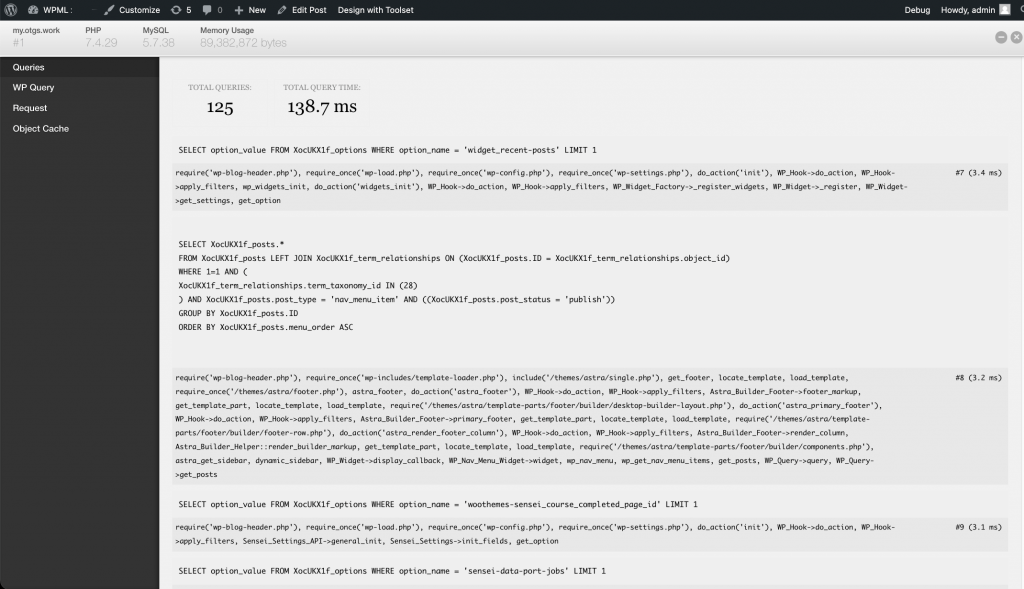
A screen with the debug information will open.
To debug your page, look for:
- Slow queries – a query with an execution time of 50-60 milliseconds.
- Repeating queries – multiple queries that take a long time to complete.
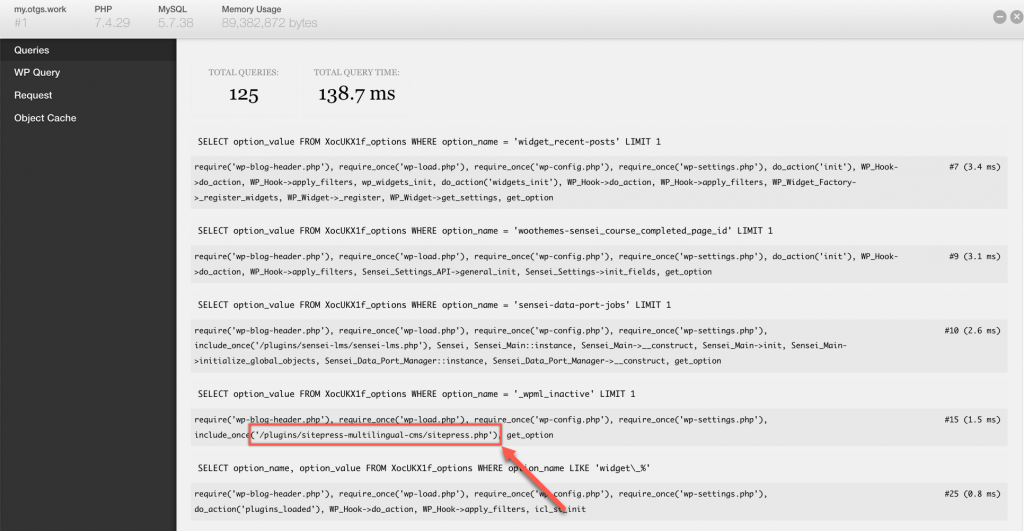
To see which plugin or theme a query is coming from, look at the call stack in the second line of each query. In the example below, the query is coming from WPML:
If you identify queries related to WPML or its add-on plugins, write down:
- The SQL query
- The call stack in the next line of query
- The query execution time
When opening a support ticket, provide this data to your supporter.


